As a part of my workplace’s tranformation to Agile Development we have quarterly “Program Increment” meetings, where a hundred people will sit in a large meeting room for 2 days, trying to figure out what we’re going to be doing for the next 3 months.
I won’t be commenting on the effectiveness of this method, only on the fact that these meetings tend to be accompanied by a lot of noise. A hundred people all talking at the same time, trying to be heard, so the volume gradually increases.
I was trying to document this problem, and what better way to do that than to throw some hardware at it :)
First step on the journey was figuring out how. While researching components, I came across this tutorial from Adafruit and figured i’d use it as a baseline for my experiment.
My initial idea was to have an anonymous data logger that i could plugin to a wall plug, and let it “do it’s thing” for 8 hours, collecting that data in a file, which i in turn could extract once i was home to create some nice graphs from. Another nice feature would be a visual monitoring solution, so i opted for a NeoPi, but lacked the time to install it, so that will have to wait until “version 2”.
Bill of materials
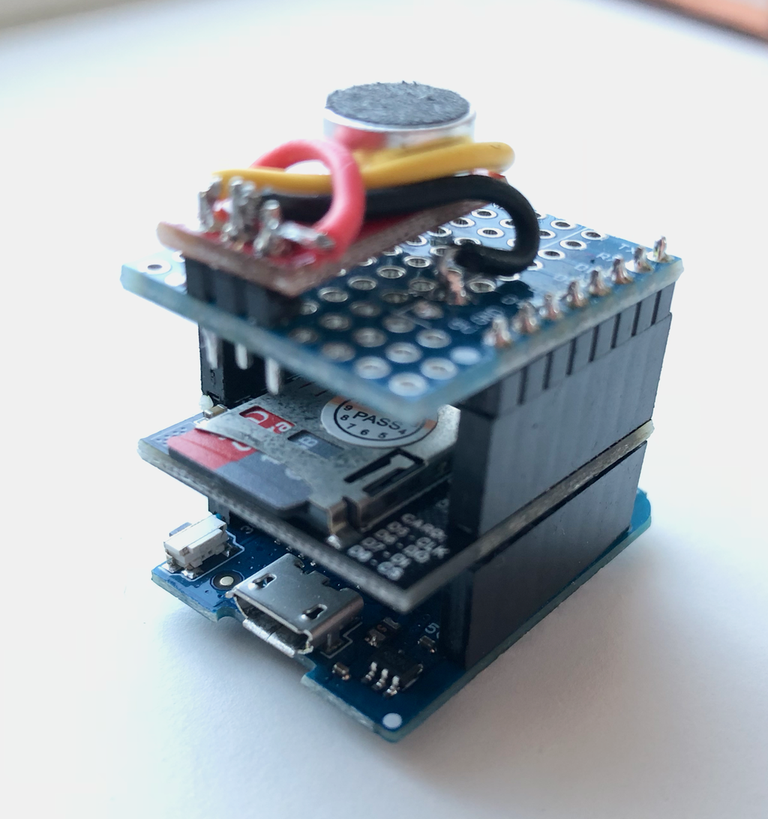
I took a quick survey of what i had lying around in the drawers, and ended up with the following
- Wemos D1 Mini Pro
- Wemos D1 Data Logger Shield (Unofficial, but has RTC as well as SD card)
- SparkFun Electret Microphone Breakout
- Adafruit NeoPixel Stick - 8x 5050 RBG LED for visual monitoring during operation.
The only component i didn’t have ready was the Microphone breakout, so i ordered one, and started soldering. With the premade shields for the D1 Mini Pro, all i had to do was wire up the microphone to the 3.3v, Gnd and A0 pin on the Wemos.

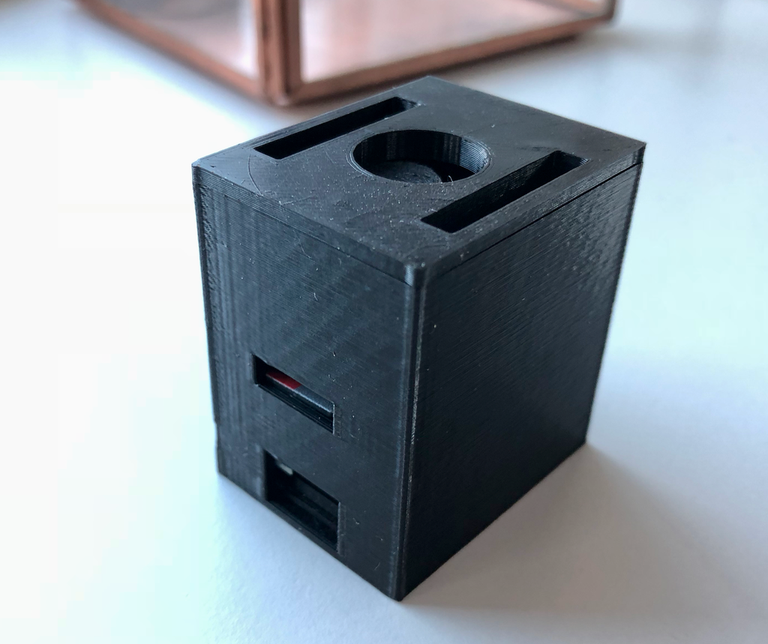
I also printed an enclosure for it to keep it safe while operating

Software
With this being a “one off” project, I decided it was time to try out Micropython again. The project is rather simple, which basically just consists of reading an analog value of a pin, and writing some representation of said value to the SD card, along with a timestamp.
I also ordered a Pyboard just for the fun of it, but it didn’t arrive before i needed the project to be ready, so i’ll have to find some other use for it. Regardless of hardware, the Micropython experience is almost identical. The Pyboard has a few more handy shortcuts available where the esp8266 platform is lacking a bit.
The Micropython website has a handy tutorial for getting up and running on an esp8266. As for the hardware specific parts, there’s a handy quick reference for the esp8266 platform.
The initial setup of the board was a breeze, and after (manually) enabling Wifi and the WebRepl prompt, i wrote a small function to place in boot.py, to be executed on every reboot.
import gc
import webrepl

webrepl.start()
gc.collect()

def do_connect():
    import network
    sta_if = network.WLAN(network.STA_IF)
    if not sta_if.isconnected():
        print('connecting to network...')
        sta_if.active(True)
        sta_if.connect('NetworkSSID', 'NetworkPassword')
        while not sta_if.isconnected():
            pass
    print('network config:', sta_if.ifconfig())


do_connect()
Sampling the Electret
Logging the data
When it came to logging the sampled data i had a couple of choices. Micropython supports Sqlite3, which would make sense for storing a lot of binary data in a cross platform safe way. I could also just dump the readings into a text file, which seemed like the less error prone way of doing it.
I ended up with a main.py program like the following
from machine import I2C, Pin, ADC
import utime
import urtc
import time
import os


def setup_rtc():
    i2c = I2C(scl=Pin(5), sda=Pin(4))
    rtc = urtc.DS1307(i2c)
    return rtc


def perform_reading(adcport):
    signalMax = 0
    signalMin = 1024
    tstart = utime.ticks_ms()
    while utime.ticks_diff(tstart,utime.ticks_ms()) < 50:  # Sample for 50 ms
        reading = adcport.read()
        if reading > signalMax:
            signalMax = reading
        elif reading < signalMin:
            signalMin = reading
    peakToPeak = signalMax - signalMin  # max - min = peak-peak amplitude
    volts = (peakToPeak * 3.3) / 1024  # convert to volts
    print(volts)
    return(volts)


def save_reading(dt, reading):
    fname = "/read{}{:02}{:02}.txt".format(dt.year, dt.month, dt.day)
    ts = "{}{:02}{:02},{:02}{:02}{:02}".format(
        dt.year, dt.month, dt.day, dt.hour, dt.minute, dt.second)
    with open(fname, "a") as f:
        f.write("{},{}\n".format(ts, reading))


def get_timestamp(rtc):
    dt = rtc.datetime()
    return dt


def main():
    rtc = setup_rtc()
    adc = adc = ADC(0)
    while True:
        try:
            r = perform_reading(adc)
            if r != -1:
                ts = get_timestamp(rtc)
                save_reading(ts, r)
        except Exception:
            pass
        time.sleep(1)


main()
Interpreting the data
Having had the sound logger running for a day, i retrieved the data, and started analysing on it.
#from datetime import datetime
import matplotlib.pyplot as plt
import matplotlib
import matplotlib.dates as mdates
import numpy as np
import pandas as pd
from datetime import datetime

with open('read20171213.txt', 'rt') as f:
    input = [l.split(',') for l in f.readlines()]

data = pd.Series({datetime.strptime(a[1],'%H%M%S').time(): abs((float(a[2]) * 1024) / 3.3) for a in input})
Peeking at the data gives us the following
data.head()
08:13:37     0.000000
08:13:39    10.999994
08:13:40     8.999998
08:13:41    10.999994
08:13:42    14.999986
dtype: float64
Initially i logged the values as a voltage, ranging from 0.0v to 3.3v (my input voltage), as this would give a clearer view. I later realised that the raw 10 bit ADC values (0-1024), were probably easier to work with, so i converted them back again.
I then made a quick graph to show the extent of the problem.
pl = data.plot(figsize=(20,10))
pl.set_ylim([0,data.max()])
(0, 855.99883636363631)

Sadly the day i chose to bring the logger was a relatively quiet day. Noise only gets unbearably high in brief spikes, and the “background noise” is fairly low. Lunch stands out as quiet, and i would compare the background noise around lunch to that of a quiet office.
The microphone used will ideally return a value close to Vin when surroundings are quiet, or in terms of ADC values, a reading will return close to 512.
Looking at the graph i only see a few spikes that go above 512.
Next step is to convert the input values into Decibel.
To do this we need to know the sensitivity of the microphone circuit, which in my case was a SparkFun Electret Microphone Breakout
According to the Datasheet the microphone has a sensitivity of -44±2.0,(0dB=1V/Pa) at 1K Hz.
1 Pa (pascal) equals 94 dB sound pressure (SPL).
The rule for converting volts to dB is
20 × log10(V1/Vo)
V1 is the voltage we read from the amp. Vo we get from the mic sensitivity : -46 DBv, which is 0.005011872 V RMS / Pa
To get to dB SPL we need to add the sensitivity of the mic (-44) to the converted reading, along with the value of 1Pa (94 dB), and finally subtract the gain of the amp.
To apply this to the logged data, we need to convert the data back to the original logged format, and then apply the formula to the data. Log doesn’t work for 0 values, so we need to filter those out as well, which is fine considering that 0 is most likely a bad reading.
import math
sensitivity_rms = float(0.005011872)
data = pd.Series({datetime.strptime('2017/12/13 {}'.format(a[1]),'%Y/%m/%d %H%M%S').time(): (20 * math.log10(math.fabs(float(a[2])/sensitivity_rms))) for a in input if float(a[2]) > 0})
We have now converted the logged volts to dB, but we still need to take into account the gain. According to the specs, the gain should be around 80V/V, but they measured it closer to 60V/V, so we’ll use that. Using the above formula for converting volts to dB, we end up with 35.563025 dB. We need to subtract the gain from the calculated dB value.
We will also use this step to convert to dB SPL.
gain = float(35.563025)
pa = float(94)
sensitivity = float(-44)
data = pd.Series({k: round(((sensitivity + data[k] + pa)- gain ),2) for k in data.to_dict()})
data = pd.DataFrame.from_dict(data)
data.rename(columns={0:'dB SPL'},inplace=True)
Lets look at how the noise level has been throughout this relatively quiet day.
pl = data.plot(figsize=(20,10))

Lets look at the most interesting values, using the describe method
data.describe()
.dataframe thead th {
    text-align: left;
}

.dataframe tbody tr th {
    vertical-align: top;
}
So:
- Minimum sound pressure amounts to 10.6 dB SPL, or at little quieter than rustling leaves in a forest.
- Average is 32.5 dB SPL, which is roughly equivalent to a quiet room.
- Maximum is 63.27, which translates to somewhere between conversation at 1m distance and a vacuum cleaner.
- Std. Deviation is rather low, meaning that noise levels are closer to the Mean.
- 25 percent of the readings has been below 29.69 dB SPL
- the Median is 34.12 dB SPL
- 75 percent of the readings has been below 38.9 dB SPL.
- 95 percent of the readings has been below 45.41 dB SPL.
The above tells us that noise generally has been acceptable (somewhere between a quiet office and conversation), and only few readings has been higher.
Conclusion
As i said, the day was relatively quiet compared to the day before, and given the nature of this “study” which is to have fun, the mic was placed alongside a wall, in a plastic enclosure which is far from optimal, which makes this even less scientific.
Also, the measuring code was ported from C, which would probably take a lot more readings in the allotted 50ms, so i might increase the time to 75-100ms and see if that makes a difference, though i’m fairly sure most of the time spent during readings is spent with activating/measuring hardware, and not spent looping around in code.
To get a meaningful measure of sound pressure, you must take into account the distance to the source, which of course is not very practical in a large conference room with ~100 people in it.
My goal was to measure the sound levels at my listening position, which is have. I will continue to measure these PI Plannings, and hopefully have the luck to capture a noisy day as well, in which case i will make another post with my findings.