 Some years ago i got into the world of Crypto Currencies by accident when the company i work for was investigating the Blockchain technology for our own use, and since i knew nothing about Crypto Currencies or Blockchains at the time, i went ahead and bought around $100 worth of Bitcoins.
I then forgot all about it for a couple of years, and only remembered when i was replacing my phone, and the wallet app popped up. I’ve since diversified my portfolio, and currently hold 6-10 different coins. I’m not actively speculating, and only “moving around” my initial gains.
Somewhere along the road i started checking my portfolio more frequently, and the idea for a “passive” tracker popped up. I briefly scanned the available parts, but could’nt find any suitable displays - i have little desire for a backlit LCD/LED display shining 24/7 - so i made a note in my “Things to do later” list, and forgot all about it.
When i stumbled over a tutorial about setting up a savings tracker, i decided it was time to pick up the idea again.
TL;DR The source for the finished program is available on Github
Gathering the parts needed
For this project i opted for using
Of course no project is complete without a 3D printed case for it, so i went ahead and printed an “official” Adafruit Raspberry Pi Zero case. Sadly the case doesn’t fit completely, so i’m still in the process of designing a new one.
Setting up the Raspberry Pi
I went with the Raspbian Stretch Lite image, as i won’t need desktop services for this project.
Setting up the Raspberry Pi for headless operation requires two files to be present on the SD Card. Both files should go on /boot.
First, create a file named wpa_supplicant.conf, with this content
ctrl_interface=DIR=/var/run/wpa_supplicant GROUP=netdev
update_config=1
network={
 ssid="NETWORKNAME"
 psk="WPAPASSWORD"
}
Don’t forget to change the ssid and psk to your own network name/password. Second, to enable SSH access, an (empty) file named ssh needs to exist.
Next we start off with the usual configuration using raspi-config, namely changing the pi user password, expanding the SD card, and for this project, we enable SPI communcation as well to be able to talk to the display.
After a reboot it’s time to update to make sure we’re on the latest version.
sudo apt update && sudo apt dist-upgrade -y
Installing the display driver
Next it’s time to install the dependencies.
sudo apt install python3-dev git libjpeg-dev python3-pip python3-spidev python3-pandas -y
For the ePaper display we’re going to be using a 3rd party library from github
git clone https://github.com/pimoroni/inky-phat.git
In order to make the WaveShare display work with the Pimoroni driver, we need to edit a file. edit the file ~/inky-phat/library/inkyphat/inky212x104.py, and change the lines below
RESET_PIN = 17
BUSY_PIN = 24
DC_PIN = 25
Next to install the library, issue the following commands
cd inky-phat/library/
sudo python3 setup.py install
At this point the needed software is installed. I wrote a small test program to confirm that everything worked as expected
import inkyphat
from PIL import ImageFont

text = "Hello World"
font = ImageFont.truetype(inkyphat.fonts.FredokaOne, 18)
w, h = font.getsize(name)
x = (inkyphat.WIDTH / 2) - (w / 2)
y = 0
inkyphat.text((x, y), text, inkyphat.RED, font)
inkyphat.show()
Writing the software
Now that we are sure the hardware is working, it is time to dig into how to extract the wanted information. We need two things, the balance of a wallet, and the exchange rates for the given currency.
I chose the following currencies for this example :
- BTC / Bitcoin. The largest of the Crypto Currencies.
- LTC / Litecoin. Bitcoin fork that attempts to fix some of the flaws of Bitcoin.
- ETH / Ethereum. The 2. largest currency, which also implements smart contracts
- XRP / Ripple. Up and coming currency, which aims to replace currency exchange between banks. Doesn’t require Proof of Work since all coins are premined.
These conviniently also make out the top-3 on coinmarketcap.com
I opted to use Kraken for exchange rates, as they have a reasonable API, as well as support for many Crypto Currencies.
%matplotlib inline
import matplotlib
import PIL
import json
import time
import locale
import krakenex

import pandas as pd
import requests
import collections
import functools

from PIL import Image
from PIL import ImageDraw
from PIL import ImageFont
from io import BytesIO

from pprint import pprint
from pykrakenapi import KrakenAPI
from collections import defaultdict

class memoized(object):
    '''Decorator. Caches a function's return value each time it is called.
    If called later with the same arguments, the cached value is returned
    (not reevaluated).
    '''

    def __init__(self, func):
        self.func = func
        self.cache = {}

    def __call__(self, *args):
        if not isinstance(args, collections.Hashable):
            # uncacheable. a list, for instance.
            # better to not cache than blow up.
            return self.func(*args)
        if args in self.cache:
            return self.cache[args]
        else:
            value = self.func(*args)
            self.cache[args] = value
            return value

    def __repr__(self):
        '''Return the function's docstring.'''
        return self.func.__doc__

    def __get__(self, obj, objtype):
        '''Support instance methods.'''
        return functools.partial(self.__call__, obj)
Getting crypto balances and exchange rates
It’s time to figure out account balances. Each crypto currency will have it’s own way of dealing with things, with the exception of currencies that are variations over the same coin, i.e. Bitcoin and Litecoin. One of the strengths of the blockchain is that every transaction is available on a public ledger, so given an address, we should be able to deduct the balance of the same address.
The root address of a Bitcoin wallet is called the xPub, which is the public key that all other public keys of that wallet are derived from. You should be careful with this address, as giving it to someone will allow them to see every transaction made to/from your wallet. Don’t get paranoid, as this information is already public, as in freely available on the Blockchain. What’s not public however is who owns a given key. Using the xpub key you can view every transaction ever made with that key, including the current balance.
We know we’re going to handle difference cryptocurrencies, so lets start by adding a generic class
class CurrencyHandler(object):
    '''Handler base class for a crypto currency'''
    def __init__(self, fiat_currency='EUR'):
        self._fiat_currency = fiat_currency

    def update(self, accounts):
        raise Exception('Not implemented')

    @memoized
    def get_logo_image(self,url):
        try:
            req = requests.get(url)
            image = BytesIO(req.content)
            img = PIL.Image.open(image)
            img = img.convert('P')
            img.putpalette((0, 0, 0, 255, 255, 255, 255, 0, 0) + (0, 0, 0)*252)
            img.thumbnail((70, 104))
            return img
        except:
            return None

    def logo(self):
        return None

    def fiat_currency(self):
        return self._fiat_currency
We add the @memoized decorator to the logo function since this is not likely to change, so we might as well just cache it.
Next let’s implement some currencies
class LtcHandler(CurrencyHandler):

    def update(self, accounts):
        total = 0
        for act in accounts:
            url = 'https://api.blockcypher.com/v1/ltc/main/addrs/{}'.format(
                act)
            req = requests.get(url)
            balance = json.loads(req.text)
            if 'final_balance' in balance:
                total += balance['final_balance']
        return total / 100000000

    def logo(self):
        return self.get_logo_image('http://ltc.133.io/images/logosizes/ltc800.png')


class XbtHandler(CurrencyHandler):

    def update(self, accounts):
        url = 'https://www.blockonomics.co/api/balance'
        addrs = ""
        for a in accounts:
            addrs += a + " "
        body = json.dumps({'addr': addrs})
        req = requests.post(url, data=body)
        balances = json.loads(req.text)
        total = 0
        if 'response' not in balances:
            pprint(balances)
            return 0
        for act in balances['response']:
            total += act['confirmed']
        return total/100000000

    def logo(self):
        return self.get_logo_image('https://bitcoin.org/img/icons/opengraph.png')


class XrpHandler(CurrencyHandler):

    def update(self, accounts):
        total = 0
        for account in accounts:
            url = "https://data.ripple.com/v2/accounts/{}/balances".format(
                account)
            req = requests.get(url)
            balances = json.loads(req.text)
            for b in balances['balances']:
                if b['currency'] == 'XRP':
                    total += float(b['value'])
        return total

    def logo(self):
        return self.get_logo_image('https://www.shareicon.net/data/512x512/2016/07/08/117527_ripple_512x512.png')


class EthHandler(CurrencyHandler):

    def update(self, accounts):
        total = 0
        for act in accounts:
            url = 'https://api.ethplorer.io/getAddressInfo/{}?apiKey=freekey'.format(
                act)
            req = requests.get(url)
            balances = json.loads(req.text)
            total += balances['ETH']['balance']
        return total

    def logo(self):
        return self.get_logo_image('https://www.ethereum.org/images/logos/ETHEREUM-ICON_Black_small.png')
We now have handler classes for updating multiple currencies currencies
For this example i used some addresses i found through Google. They’re not mine, and i have no idea who owns them, but for demonstration purposes they’ll do just fine.
Let’s implement a class to tie the different currency trackers together.
class CryptoTracker(object):

    def __init__(self):
        api = krakenex.API()
        self.k = KrakenAPI(api)

    def get_exchange_rate(self, crypto, fiat):
        pair = "X{}Z{}".format(crypto, fiat)
        ticker = self.k.get_ticker_information(pair)
        return ticker

    def get_currencies(self):
        return {
            'XRP': XrpHandler(),
            'ETH': EthHandler(),
            'XBT': XbtHandler(),
            'LTC': LtcHandler(),
        }

    def get_local_currency(self):
        return 'DKK'

    def get_exchange_rates(self, base=None):
        url = 'https://api.fixer.io/latest'
        if base is not None:
            url += '?base={}'.format(base)
        req = requests.get(url)

        rates = json.loads(req.text)
        return rates['rates']

    def update_currencies(self):
        #Random accounts i picked up via Google, THEY'RE NOT MINE!
        accounts = {
            'XRP' : ['rDMAMUvauRSHfJeA786HHahGR49HjxihYW'],
            'XBT' : ['14j3us479jTySjG6Tr4uY4Nrx37iTM8QHF'],
            'ETH' : ['0x3ff51120d34f4318b6aff85dbca5481dbf03f40b'],
            'LTC' : ['LVVNdZzhrBcGEMqbeLBt7VmkxQCp4iLXBB']
        }

        balances = defaultdict(float)
        rates = defaultdict(float)
        crypto_currencies = self.get_currencies()

        for curr in crypto_currencies.keys():
            ohlc = self.get_exchange_rate(curr, crypto_currencies[curr].fiat_currency())
            if ohlc is not None and len(ohlc) > 0:
                rates[curr] = float(ohlc.iloc[0]['c'][0])
            balances[curr] += crypto_currencies[curr].update(accounts[curr])
        positions = {curr: balances[curr] * rates[curr] for curr in balances if curr in rates and curr in balances}
        return balances, positions
tracker = CryptoTracker()
balances,positions = tracker.update_currencies()
balances
defaultdict(float,
            {'ETH': 0.00046252109149204,
             'LTC': 0.32484406,
             'XBT': 0.00221814,
             'XRP': 50.691873})
Visualizing the data
We have a lot of information to display, and very little room to do so. I came up with a list of things i wanted to be on the display. The trick (for me at least) is not to have too many screens, but at the same time have enough information that i won’t have to check on my phone or pc.
The list goes something like this
- Portfolio distribution
- balance for each currency, along with FIAT value
- total FIAT value of entire portfolio
- percent change over the last 24 hours.
The device isn’t meant for day trading, but simply as a way of keeping track of how my portfolio is doing, which is why 24 hours is “good enough” to track changes.
So lets dive straight into the first bullet point, Portfolio distribution. We’ll start by plotting a simple bar chart displaying each currency next to the other.
s = pd.Series(balances)
s.plot(kind='bar')
<matplotlib.axes._subplots.AxesSubplot at 0x81871b710>
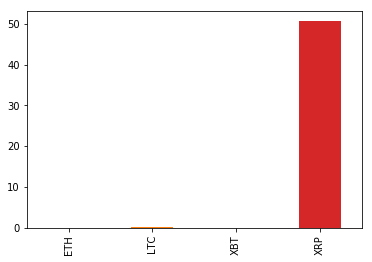
Apparently not all crypto currencies are created equal, and the massive amount of XRP present completely washes out the ETH and XBT balances. We’re going to need a common denominator to compare them, so let’s convert each currency into FIAT currency and try again.
v = pd.Series(positions)
v.plot(kind='bar')
<matplotlib.axes._subplots.AxesSubplot at 0x818a3ba20>
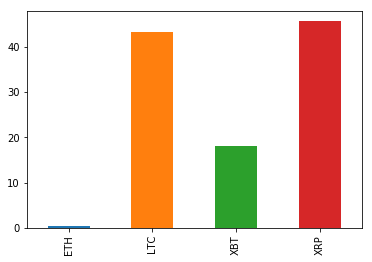
Much better. Now we can see that the major part of the portfolio is divided between XRP and LTC, and about 1/3 in XBT and ETH.
Creating images to fit the small screen.
Time to think about the actual information we want displayed, and how we want to present it on the ePaper display. My idea was the present each currency by itself, and switch displays every 20 seconds or so, finalizing the slideshow with a graph showing holdings, and a graph showing gains/loss over time.
The specific model i use is a WaveShare 2.13" e-Paper HAT, which has a resolution of 212x104 pixels. Furthermore it’s 2.13 x 1.09 inches. Matplotlib has a figsize option to specify the graph size in inches.
Pandas uses a default dpi of 80, where 212/ 80 gives us 2.65, likewise for the y axis, 104 / 80 is 1.3
The WaveShare display only has a palette of 3 colors, White, Black and Red, so we plot the bars in red, use white for the background, and black for text. We will also turn off the Y axis labels, as these won’t be readable on a small scale image.
plot = v.plot(kind='bar',figsize=(3,1), fontsize=13, color=['r',])
plot.set_facecolor('w')
x_axis = plot.axes.get_yaxis()
x_axis.set_visible(False)
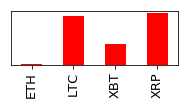
In order to try to make the image look good, matplotlib uses a 256 color palette, and also applies antialiasing, which causes the palette to grow from the intended 3 colors.
In order to show the image on the display, we have to convert it to a PIL image first, and we’ll use this step to convert the image to a 3 color palette via PIL.
class inkyphat(object):
'''Dummy object to allow running inside Juptyer'''
WIDTH=212
HEIGHT=104
class fonts():
FredokaOne = 'Arial.ttf'
def set_image(self):
pass
class DisplayHandler(object):
palette_colors = (0, 0, 0, 255, 255, 255, 0, 0, 255) + (0, 0, 0)*252
def __init__(self, cryptotracker):
locale.setlocale(locale.LC_ALL, 'da_DK.ISO8859-1')
self.cryptotracker = cryptotracker
def cga_quantize(self, image):
pal_image = Image.new("P", (1, 1))
pal_image.putpalette(self.palette_colors)
return image.convert("RGB").quantize(palette=pal_image)
def ax_to_image(self, ax):
buf = BytesIO()
fig = ax.get_figure()
fig.savefig(buf, format='png', dpi=fig.dpi, bbox_inches='tight')
im = Image.new('RGB', (inkyphat.WIDTH, inkyphat.HEIGHT),
(255, 255, 255))
pi = Image.open(buf)
pi.thumbnail((inkyphat.WIDTH, inkyphat.HEIGHT))
w, h = pi.size
xo = (inkyphat.WIDTH - w)//2
yo = (inkyphat.HEIGHT - h)//2
im.paste(pi, (xo, yo), pi)
return self.cga_quantize(im)
def get_position_image(self, positions):
v = pd.Series(positions)
plot = v.plot(kind='bar', figsize=(2.3, 1), fontsize=13, color=['r', ])
plot.set_facecolor('w')
x_axis = plot.axes.get_yaxis()
x_axis.set_visible(False)
return self.ax_to_image(plot)
def create_image(self, logo, lines):
im = Image.new("P", (inkyphat.WIDTH, inkyphat.HEIGHT), 128)
im.putpalette(self.palette_colors)
draw = ImageDraw.Draw(im)
draw.rectangle((0, 0, inkyphat.WIDTH, inkyphat.HEIGHT),
fill='white', outline='white')
x_offset = 0
if logo is not None:
logo = self.cga_quantize(logo)
w, h = logo.size
ypos = (inkyphat.HEIGHT - h)//2
im.paste(logo, (0, ypos))
x_offset = 71
max_fontsize = 22
y_offset = (inkyphat.HEIGHT - (max_fontsize * len(lines))) // 2
for text in lines:
fontsize = max_fontsize
fits = False
while not fits and fontsize > 5:
font = ImageFont.truetype(inkyphat.fonts.FredokaOne, fontsize)
w, h = font.getsize(text)
if w < inkyphat.WIDTH - x_offset:
fits = True
else:
fontsize -= 1
draw.text((x_offset, y_offset), text, (255, 0, 0), font=font)
y_offset += fontsize + 1
return im
def get_24hour_value(self, current_value, balances):
since = time.time() - 60*60*24
old_value = 0
crypto_currencies = self.cryptotracker.get_currencies()
for curr in crypto_currencies.keys():
ch = crypto_currencies[curr]
if balances[curr] <= 0:
continue
oh = self.cryptotracker.k.get_ohlc_data('X{}Z{}'.format(curr, ch.fiat_currency()), interval=5, since=since, ascending=True)
old_value += balances[curr] * oh[0]['close'][-1]
change = current_value - old_value
return (100/old_value)*change
def standing_images(self):
balances, values = self.cryptotracker.update_currencies()
rates = self.cryptotracker.get_exchange_rates()
crypto_currencies = self.cryptotracker.get_currencies()
local_currency = self.cryptotracker.get_local_currency()
local_total = round(sum(values.values()), 2) * \
rates[self.cryptotracker.get_local_currency()]
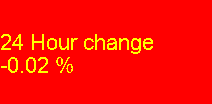
yield self.create_image(None, lines=('24 Hour change', '{} %'.format(round(self.get_24hour_value(sum(values.values()), balances)), 2)))
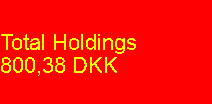
yield self.create_image(None, lines=['Total Holdings', local_currency, locale.currency(local_total, grouping=True, symbol=False)])
for curr in crypto_currencies.keys():
total = round(values[curr]*rates[local_currency], 2)
yield self.create_image(crypto_currencies[curr].logo(), (curr, str(balances[curr]), local_currency, locale.currency(total, symbol=False, grouping=True)))
def show_slideshow(self, delay=30):
for image in self.standing_images():
inkyphat.set_image(image)
inkyphat.show()
time.sleep(delay)
display = DisplayHandler(tracker)
display.ax_to_image(plot)
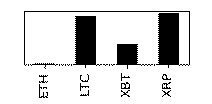
While not exactly a work of art, it does get the job done.
Displaying currency balances.
We also need to create a method to display currency balance. We could use the inkyphat methods for this, but since we need to display an empty image to “clear” the display anyway, it’s just as easy to just create the image ourselves and replace the currently displayed image.
The display handler class takes care of converting the CryptoHandler information into images we can easily display on the e-Paper Hat.
Please ignore the horrible colors. The e-Paper HAT displays a white background with black text and a red logo
images = list(display.standing_images())
images[3]
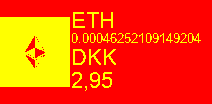
We now have a list of images, displaying the standing of each currency, along with a logo for the currency. We also have an graph showing the distribution of our investment across currencies. It wouldn’t be complete unless it also showed the total investment. Fortunately this is easy with the methods we defined above.
Converting from EUR/USD to local currency
Finally, while the FIAT currency is bound to whatever the chosen exchange supports as trade pairs, i’d like to view the balance in my local currency, which is Danish Kroner, or DKK.
import locale
locale.setlocale(locale.LC_ALL,'da_DK.ISO8859-1')

exchange_rates = tracker.get_exchange_rates()
local_total = round(sum(positions.values())*tracker.get_exchange_rates()['DKK'],2)
display.create_image(None, lines = ['Total Holdings',locale.currency(local_total, international=True, grouping=True)])
Displaying 24 hour growth/loss
We would also like to know how much our holdings have changed in the past 24 hours, and to do so we must get the OHLC (Open High Low Close) values from the exchange.
pctchg = round(display.get_24hour_value(sum(positions.values()), balances),2)
display.create_image(None, lines=('24 Hour change', '{} %'.format(pctchg)))
With all our images in place, it’s time to create a carusel for rotating the images on the e-Paper hat.
def show_slideshow(slideshow, delay=30):
    update_balances()
    for image in standing_images():
        inkyphat.set_image(image)
        inkyphat.show()
        time.sleep(delay)
Conclusion
And that’s it. We now have the skeleton for a crypto currency tracker, that takes the balances of multiple accounts, for multiple currencies, and cycles through various useful information every 30 seconds.
The end result of the above is available from Github, with a few changes. Mostly that all the hardcoded values above are read from a JSON configuration file.