As part of monitoring the general health of my Raspberry Pi boxes, i like keeping a historical image of how the load was at a given time. I have real time monitoring in place, which will alert me via Pushover if something goes haywire1, and my surveillance does it’s own checking and alerts (via the same pushover container) if a sensor fails to report within a given period.
I based my graph generating script on the one described here, though the memory calculation in that script is not what i wanted, and this being a memory restricted platform, i also wanted to monitor swap in/out. There was also a problem parsing the actual sar data on a debian platform, as apparently not all sar commands are created equal.
My modified version of the script is available at gist.github.com
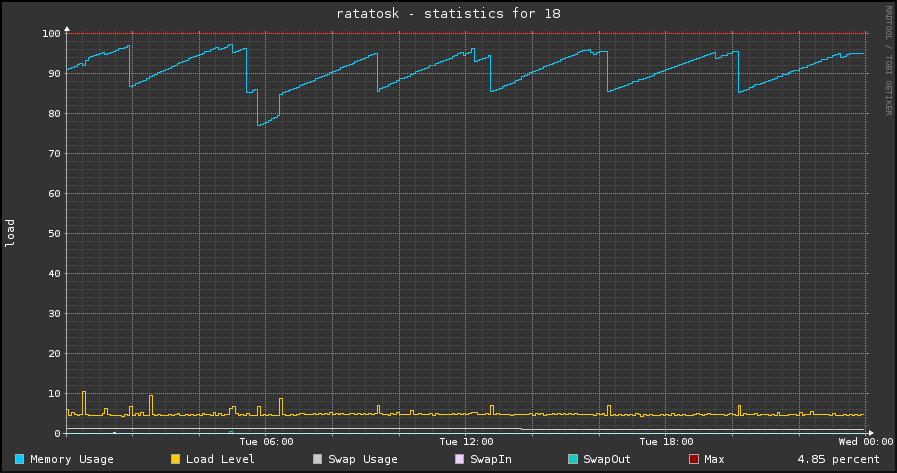
The result on a normal boring day looks something like this
The things to look out for is when the swap starts looking like this
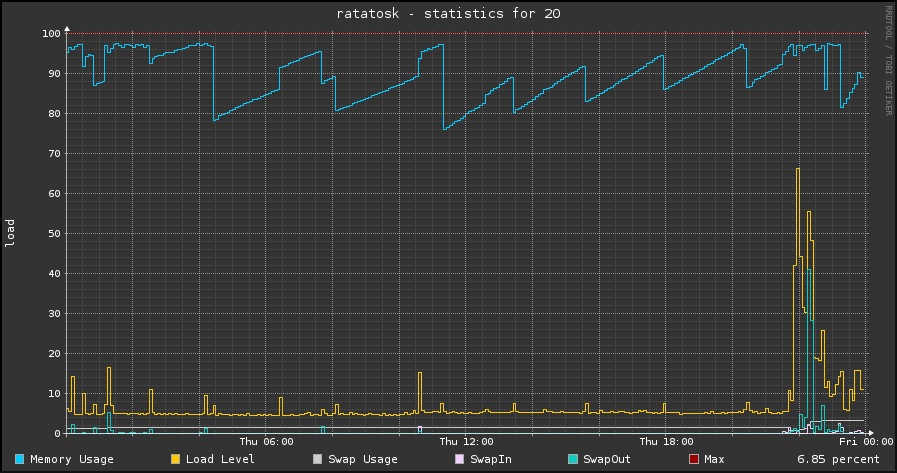
This might not be a problem if it’s just a single instance, but it could indicate that you’re running on the limit of what the hardware supports.
I run this script every 5 minutes via Cron like this
*/5 * * * * /usr/bin/python /usr/local/bin/sa2pyrrd.py -d`date +%d` -o /var/www/html/load/
Which updates the graph for the current day every 5 minutes and outputs the resulting png file directly into the web server data directory. In time graphs are available for a full month, at which point they’re simply overwritten.
There are plenty of more advanced monitoring solutions, and almost all of them require a much larger fraction of system resources to do their job. Granted they also provide much more detailed information, but i find the RRD Graphs a good way of getting a birds eye view on performance, and should i need to dig deeper i can do this via the sar command.
-
Nothing fancy, just a simple python script that checks the system load, free memory and swap used, and “pings” a list of services. It does this every 5 minutes or so. If anything fails, i get alerted. ↩︎